21 Key Email Marketing Analytics Points in 2026 📩
Mastering email marketing analytics can make all the difference between email marketing mediocrity and glory. Find out what to track, and how to calculate it.
Updated November 6, 2024

Imagine you started building a house, but didn't know how large your land is, how many bricks you need to buy, or how much money you have to spend. Would you be able to complete the project successfully? Probably not. The same applies to email marketing. Without knowing key analytics, it's impossible to make informed decisions and get the results you want.
Email marketing continues to be one of the best ROI channels for marketers. But you need to know your numbers inside and out to make the most out of it.
Ready to know more? Keep reading to find out everything you need to know about key analytics to keep in mind for your email marketing strategy.
Top 21 essential email analytics
Knowing your email metrics means you can create a smarter, better email marketing strategy. It allows you to understand what is and isn't working so you can make informed decisions about your email campaigns.
Here are some email marketing analytics to follow to upgrade your strategy, get more engagement, and drive more revenue to your business:
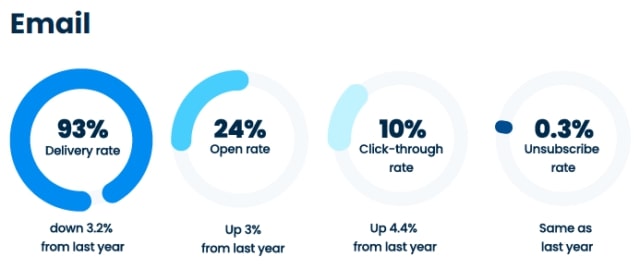
Click-through rate
The email click-through rate (CTR) is a critical email marketing metric that quantifies the percentage of people in your email list who have clicked on a particular link within your marketing email. This metric provides insight into how compelling or intriguing your content and call-to-actions (CTAs) are for your audience.
To calculate the click-through rate, divide the total number of unique clicks on a link by the total number of delivered emails, and then multiply the result by 100 to get the percentage.
For example, if you sent your email to 1000 people, and 50 people clicked on your designated link, your CTR is 5%. This means that 5% of the recipients found your content engaging enough to take action, providing valuable insight into the effectiveness of your email content and CTAs.
(Source)
Open rate
The open rate is another crucial metric in measuring email performance. It provides a glimpse into the effectiveness of your email subject lines and the relevancy of your content to your target audience.
To calculate the open rate, divide the total number of opened emails by the total number of delivered emails, and then multiply the result by 100 to get a percentage.
For instance, if you sent an email to 2000 people and 400 of them opened your email, your open rate is 20%. This signifies that 20% of the recipients were interested enough in your subject line to open the email, giving you a significant measure of the impact of your subject lines and the initial appeal of your content.
Conversion rate
The conversion rate is a powerful email marketing metric that shows the percentage of email recipients who completed a desired action such as making a purchase, filling out a form, or downloading a resource. This metric directly ties your email marketing efforts to outcomes and offers insight into the overall effectiveness of your marketing strategy.
To calculate the conversion rate, divide the total number of desired actions taken by the total number of delivered emails, and then multiply the result by 100 to get a percentage.
Suppose you've sent an email to 3000 people promoting a product, and 150 of these recipients purchased it. Your conversion rate is 5%, suggesting that your email campaign successfully drove 5% of recipients to complete the desired action of purchasing the product.
Bounce rate
Email bounce rate is a vital email marketing metric that indicates the percentage of your sent emails that could not be delivered to the recipient's inbox. There are two types of bounces to consider:
- Hard bounces indicate a permanent issue with the email address, and
- Soft bounces occur when a temporary issue, like a full inbox or a server problem, prevents delivery.
High bounce rates can negatively affect your sender's reputation, leading to lower overall deliverability rates in the future.
To calculate the bounce rate, email marketers divide the total number of bounced emails by the total number of emails sent, then multiply the result by 100 to convert it to a percentage.
For example, if you send 5000 emails and 200 emails bounce, your bounce rate is 4%. This means that 4% of your emails were not successfully delivered, and you should look for potential issues with the quality of your email list or problems with specific email servers.

(Source)
List Growth rate
The list growth rate is a critical metric in email marketing that measures how quickly your email list is growing. The list growth rate considers the number of new subscribers, the number of unsubscribed, and any email addresses that have bounced.
To calculate the list growth rate, subtract the number of unsubscribes and bounced emails from the number of new subscribers. Then, divide this by the total number of email addresses on your list. Multiply this result by 100 to convert it to a percentage.
Say you gained 200 new subscribers this month, but 50 unsubscribed, and 10 emails bounced. If you started with an email list of 4000, your list growth rate would be calculated as follows:
- Subtract the sum of unsubscribes and bounced emails (50+10=60) from the number of new subscribers (200), which in our case equals 140
- Divide that total (140) by the original number of email addresses (4000), resulting in 0.035
- Multiply by 100 to find the percentage of your monthly list growth rate, which here is 3.5%.
Even if your email list has grown by just 3.5% this month, this indicates a positive trend in expanding your audience reach. This is a great sign! Remember: while there are industry benchmarks to strive for, it's more accurate to compete with your own stats from one month to the next.
Email forwarding rate
The email forwarding rate is a valuable metric for the percentage of email recipients who have forwarded your email to others. This metric provides insights into your content's shareability and viral potential, as a high forwarding rate indicates content that resonated with your audience enough for them to share it with others.
To calculate the email forwarding rate, divide the total number of emails forwarded by the total number of delivered emails and then multiply the result by 100 to yield a percentage.
So if you send an email to 5000 people, and 100 of them forward your email, your email forwarding rate would be 2%. This means that 2% of your emails were engaging enough to be forwarded by the recipients.
Return on investment
Return on Investment (ROI) is a key performance indicator used to measure the profitability of an investment. In the context of email marketing, it measures the return on investment for your email campaigns. ROI helps you understand the effectiveness of your campaigns in terms of financial return, making it easier to decide where to allocate resources in the future.
To calculate Email Marketing ROI, you first need to know the total revenue generated from the email campaign and the total spent on the campaign. The ROI formula is:
ROI = [(Revenue - Cost of the campaign) / Cost of the campaign] * 100
Suppose you spent $1000 on an email marketing campaign. After analyzing the results, you found that the campaign generated $5000 in revenue. Calculate the ROI by subtracting the cost from the revenue ($5000 - $1000 = $4000), dividing the result by the cost ($4000 / $1000 = 4), and multiplying by 100 to get a percentage. This results in an ROI of 400%.
That's one successful campaign!

(Source)
Unsubscribe rate
The unsubscribe rate is another crucial metric in email marketing. It represents the percentage of subscribers who opt out of your email list after receiving an email campaign. A high unsubscribe rate could signal that your content is not aligning with your audience's needs or interests. Monitoring this metric regularly is crucial to ensure your content remains relevant and engaging for your target audience.
To calculate the unsubscribe rate, you divide the total number of people who unsubscribed by the total number of emails delivered. Multiply the result by 100 to find the percentage.
Say you send an email campaign to 5,000 subscribers and 50 unsubscribe from your list. In this case, your unsubscribe rate would be calculated as follows:
50 (unsubscribes) divided by 5000 (total delivered emails) equals 0.01.
Multiply this by 100 to convert to a percentage, which means your unsubscribe rate is 1%. This means that 1% of the recipients have chosen to opt out of your email list after receiving your email campaign.
Deliverability rate
In email marketing, the deliverability rate is a crucial metric indicating the percentage of your emails that successfully reach the recipient's inbox. This metric is essential to understand your campaign's reach and the effectiveness of your email practices. A low deliverability rate may indicate issues such as poor list quality, a damaged sender reputation, spam reports sent by subscribers, or the presence of spam-like content in your emails.
To calculate the deliverability rate, divide the number of emails delivered by the total number of emails sent and then multiply the result by 100 to convert it to a percentage.
If you sent out 5000 emails for a marketing campaign, and you found out that 4800 were successfully delivered to the recipients' inboxes, your deliverability rate would be calculated as follows:
4800 (delivered emails) divided by 5000 (total sent emails) equals 0.96. Multiply by 100 to convert to a percentage, resulting in a deliverability rate of 96%.
This means that 96% of your sent emails successfully reached your recipients' inboxes, indicating a high level of deliverability and effective email practices.
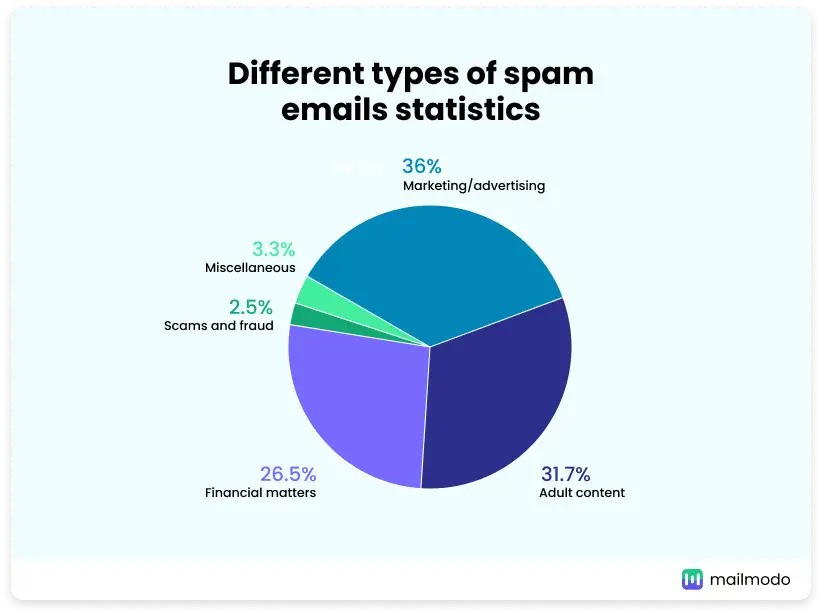
Spam rate
The spam rate refers to the percentage of your emails that get spam complaints, meaning people have marked your emails as spam. A high spam rate can damage your sender's reputation and lead to reduced email deliverability and reach, so it's a critical metric.
To calculate the spam rate, divide the total number of emails marked as spam by the total number of emails delivered, then multiply the result by 100 to convert it to a percentage.
Back to our example. If you sent out 5000 emails and 100 of those emails were marked as spam by the recipients, you'd calculate your spam rate as follows:
100 (emails marked as spam) divided by 5000 (total delivered emails) equals 0.02. Multiply this by 100 to convert to a percentage, equating to a spam rate of 2%.
This means that 2% of your sent emails were marked as spam, indicating that you may need to create more relevant content or ensure you don't use any spam triggers.
(Source)
Click to open rate
The click-to-open rate (CTOR) provides insight into the effectiveness of your email content and design by showing the percentage of recipients who clicked on a link in your email after opening it. This metric helps in understanding whether your email content is engaging and resonates with your audience.
To calculate the CTOR, divide the number of unique clicks by the number of unique opens. Multiply the result by 100 to convert it to a percentage.
Example: you sent your email campaign to 5000 subscribers. 1000 of them opened the email, and 200 clicked on a link within the email. Your CTOR would be calculated by
200 (unique clicks) divided by 1000 (unique opens), which equals 0.2. Multiply this by 100 to convert to a percentage, resulting in a CTOR of 20%.
So if 20% of the recipients who opened your email clicked on a link, your email content and design are successfully engaging your audience.
Unsubscribe rate
The unsubscribe rate in email marketing refers to the percentage of recipients who opt out or unsubscribe from your email list after receiving an email. This metric is crucial as it can provide insights into the relevancy and value of your content to your audience. A high unsubscribe rate can indicate dissatisfaction and prompt you to review and adjust your content strategy.
To calculate the unsubscribe rate, you divide the number of unsubscribes by the total number of emails delivered, and then multiply the result by 100 to convert it to a percentage.
Suppose you sent an email campaign to 5,000 subscribers and 50 of those people unsubscribed. Calculate as follows:
50 (unsubscribes) divided by 5,000 (total delivered emails) equals 0.01. Multiply this by 100 to convert to a percentage, resulting in an unsubscribe rate of 1%. Even if 1% of the recipients opted out of your emails, you should look into whether those contacts have something in common, and see if there's a particular audience segment that you should reassess your email content and audience targeting strategy for.
List growth rate
The list growth rate refers to the growth of your email list over a certain period. It's a key metric that helps you understand how effectively you're building and expanding your subscriber base. A healthy list growth rate indicates that your marketing efforts are attracting and retaining new subscribers, which is crucial for the overall success of your email marketing campaigns.
To calculate the list growth rate, subtract the number of unsubscribes and bounces from the number of new subscribers you gained within a specific period. Then divide this by the size of your email list at the start of that period, and multiply the result by 100 to convert it to a percentage.
Say you had 5,000 subscribers at the beginning of the month. Then throughout the month, you gain 500 new subscribers, but 50 people unsubscribed and 20 emails bounced. You'd calculate your list growth rate as follows:
Subtract the number of unsubscribes (50) and bounces (20) from the number of new subscribers (500). In our case, this results in 430. Divide this number (430) by the total number of subscribers at the start of the month (5,000), giving you 0.086. Multiply this by 100 to convert it to a percentage, resulting in a list growth rate of 8.6%.
This means that your email list grew by 8.6% during the month.
Read rate
Your email read is an estimate of how many subscribers – you guessed it! – read your emails.
Unlike the open rate, the read rate measures the number of people who spend a significant amount of time with your email open. This suggests that they've read your content, and are interested and engaged with your campaign. This metric provides an important insight into your audience's behavior so that you can deliver more relevant types of content.
To calculate the read rate, divide the number of emails read by the total number of emails delivered, then multiply the result by 100 to convert it to a percentage.
For instance, suppose you sent an email campaign to 5,000 subscribers, and 800 were read. Your read rate would be calculated as follows:
800 (emails read) divided by 5,000 (total delivered emails) equals 0.16. Multiply this by 100 to convert to a percentage, resulting in a read rate of 16%.
So 16% of the emails you sent were opened and read, shedding light on the relevance and appeal of your content to your audience.

(Source)
Reply rate
The reply rate in email marketing refers to the percentage of recipients who responded to your email. This metric is important for gaining insights into the level of engagement and interaction your content generates. More replies often suggest that your audience found your content compelling enough to start a conversation, making it a key indicator of your email campaign's success.
Calculate the reply rate by dividing the number of email replies by the total number of emails delivered, then multiply the result by 100 to convert it to a percentage.
Example time! Suppose you sent an email campaign to 5,000 subscribers and received 100 replies. Calculate your reply rate thus:
100 (email replies) divided by 5,000 (total delivered emails) equals 0.02. Multiply this by 100 to convert to a percentage, resulting in a reply rate of 2%. This means that 2% of the recipients responded to your email.
Submission rate
The submission rate in email marketing refers to the percentage of recipients who completed a desired action, such as filling out a form or survey, as a result of your email. This metric is critical for evaluating the effectiveness of your calls to action and offers a direct measure of your email's ability to persuade recipients to engage further with your brand or product.
To calculate the submission rate, divide the number of successful completions (submissions) by the total number of emails delivered, then multiply the result by 100 to convert it to a percentage.
Say you sent an email campaign to 5,000 subscribers, and 250 of these subscribers completed the survey linked in your email. Your submission rate would be calculated as follows:
250 (successful submissions) divided by 5,000 (total delivered emails) equals 0.05. Multiply this by 100 to convert to a percentage, resulting in a submission rate of 5%.
Unengaged subscribers
A group of unengaged subscribers is a term that refers to the segment of your email list that consistently shows no activity or interaction with your email campaigns over a certain period. This lack of engagement could be characterized by not opening your emails, clicking on any links, or responding to your calls to action.
Monitoring the number of unengaged subscribers helps you identify ineffective content or targeting strategies and provides insights into improving your email marketing campaigns. It is also an important tool for maintaining a clean email list.
To calculate the percentage of unengaged subscribers, divide the number of subscribers who have not opened or clicked on any of your emails over a certain period by the total number of subscribers. Multiply the result by 100 to get the percentage.
Suppose you have an email list of 10,000 subscribers. Over the past six months, 2,000 subscribers have not opened or clicked any of your emails. The percentage of unengaged subscribers would be calculated as follows:
2,000 (unengaged subscribers) divided by 10,000 (total subscribers) equals 0.2. Multiply this number by 100 to convert to a percentage, resulting in an unengaged rate of 20%.
This means that 20% of your subscribers have not interacted with your email campaigns over the past six months, signaling a potential need to reassess your content strategy or subscriber list.
(Source)
Lead-to-customer conversion rate
The lead-to-customer conversion rate is another important yet often forgotten metric. It measures the percentage of leads (potential customers) who have become paying customers due to your email campaigns. This metric is fundamental to understanding the effectiveness of your email marketing strategies in converting interested readers into actual customers, and it provides insights into the overall return on investment of your email marketing efforts.
To calculate the lead-to-customer email conversion rate, divide the number of new customers obtained from the email campaign by the total number of leads generated. Then, multiply the result by 100 to convert it to a percentage.
So if you sent an email campaign to 1,000 leads, and 50 of those leads made a purchase, your lead-to-customer conversion rate would be calculated as follows:
50 (new customers) divided by 1,000 (total leads) equals 0.05. Multiply by 100 to convert to a percentage, resulting in a lead-to-customer conversion rate of 5%.
This means that 5% of the leads generated by your email campaign became customers, indicating the effectiveness of your campaign in driving sales (or not).
Number of new leads generated
The number of new leads generated in email marketing refers to the number of potential customers who have shown interest in your product or service as a result of your email campaigns. This metric is crucial for evaluating the effectiveness of your email marketing strategies in sparking interest and attracting potential customers.
To calculate the number of new leads generated, track the number of prospects who have engaged with your email – such as clicking on a link within the email that directs them to your website or a landing page – and have then performed an action showing interest. This action could be filling out a form, requesting more information, or signing up for a product demo or a trial.
Say you send a marketing email to 10,000 subscribers promoting a new product. The email includes a link to a landing page where the subscriber can sign up for a free trial. If 500 subscribers click on the link and sign up for the free trial, the campaign has generated 500 new leads.
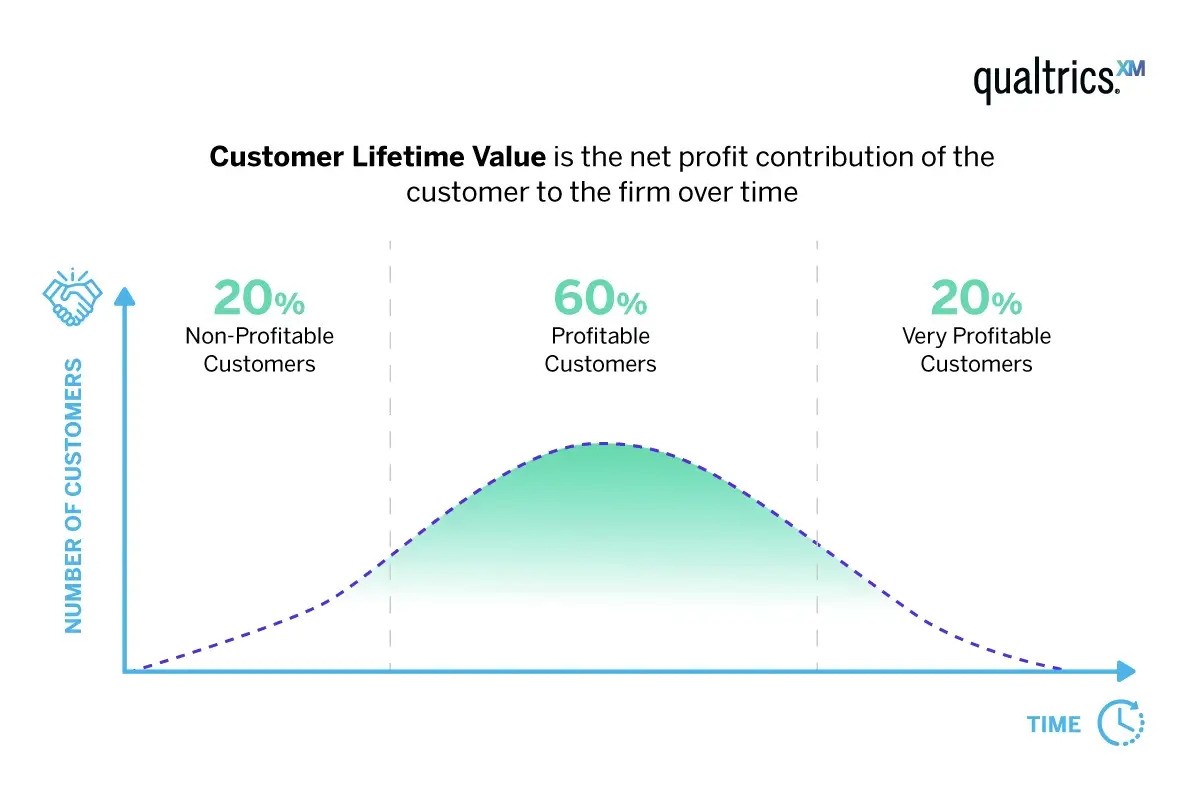
Subscriber lifetime value
Subscriber lifetime value (LTV) in email marketing refers to the total revenue you can expect to generate from a subscriber throughout their association with your brand. This important metric helps you understand the long-term value of acquiring and retaining subscribers and aids in making strategic decisions about marketing spend, resource allocation, and profitability.
To calculate the subscriber LTV, multiply the average purchase value by the average purchase frequency to get the customer value, then multiply this by the average customer lifespan.
Suppose the average purchase value of a subscriber is $50, and they purchase about 4 times a year. The customer value if $200 (i.e., $50 x 4). If the average customer lifespan is 3 years, then the subscriber LTV would be $600 (i.e. $200 x 3).
(Source)
Email client use
Email client use in email marketing refers to the various platforms or applications your subscribers use to read your emails. This includes different desktop clients like Microsoft Outlook, Apple Mail, and webmail clients like Gmail, Yahoo! Mail, and email providers on mobile devices. Understanding your device statistics is essential in ensuring your emails are optimized for and accessible to all your subscribers, irrespective of platform.
To calculate the percentage of email client use or device type use, divide the number of emails opened in a specific email client by the total number of emails opened, then multiply the result by 100 to convert it to a percentage.
Let's consider an example: Suppose you sent out an email campaign to 1,000 subscribers, and 300 of those emails were opened in Gmail. Your email client use for Gmail would be calculated as follows: 300 (emails opened in Gmail) divided by 1,000 (total emails opened) equals 0.3. Multiply this by 100 to convert to a percentage, resulting in an email client use of 30% for Gmail. This means that 30% of your subscribers are opening your emails using Gmail, indicating the importance of optimizing your email design and content for this platform.
How to use data to draw insights
Data is golden, and most email marketing tools can provide you with a lot of it, but it will only serve you much if you do something with it. To draw actual insights from your email analytics,
- Regularly review your data. Email metric analysis should be ongoing. By regularly reviewing your data, you can track trends and patterns over time and make informed decisions about future campaigns.
- Compare metrics across campaigns. Understanding the different performance levels of past email campaigns helps you identify what works and what doesn't. Look for correlations between different metrics and use them to optimize your strategies.
- Consider the bigger picture. While individual metrics are important, it's also essential to look at the bigger picture. For example, a high open rate may not mean much if it doesn't result in click-throughs or conversions. Make sure to consider all relevant data points to gain a comprehensive understanding of your email marketing performance.
- Stay informed on industry benchmarks. It's helpful to compare your metrics with industry benchmarks to understand how you stack up against your competitors and identify areas for improvement.
Here are a few bonus tips on making sure you interpret data correctly:
- Ensure you have a clear understanding of what each metric means and how it is calculated.
- Consider the context in which the data was collected, such as seasonality or any external factors that may have influenced the results.
- Use A/B testing to compare different elements of your emails and see how they affect your metrics.
- Don't just focus on one metric, but rather look at the data holistically to gain a comprehensive understanding of your email marketing performance.
- Don't make rushed decisions, but don't wait too long either. Regularly reviewing and analyzing your data will help you make informed decisions promptly.
- Be open-minded and willing to adapt your strategies based on the insights drawn from your data.
Email analytics: the key to getting more from your email marketing
True – you could get by with checking open rates and click-through rates and calling it a day. But a closer look at your email analytics gives valuable insights that you can translate into more effective campaigns, better customer relationships, and ultimately, higher returns on investment.
Use data to your advantage and work to improve your email marketing performance – the rewards will be worth it in the long run.
Need help putting your email marketing analytics in order, and making sure you use all this data to the advantage of your business? Hire a Mayple-vetted email consultant. Just contact us and we'll match you with the best expert for your niche!