The Ultimate Guide to A/B Testing for Ecommerce
Learn how to set up an A/B test for your eCommerce site, which tools to use, and some of the best testing strategies + get a [FREE Testing Template]
Updated November 6, 2024

The main goal of conversion rate optimization is to increase your site conversion, and you can’t do that just by adding a few popups and plugins.
You have to actually change elements on your site. But you can’t do that willy-nilly. Some of the worst marketing decisions are made because of an opinion or a “gut feeling” of someone on the team. Every A/B testing specialist knows that you have to base every decision on real user data.
So, before you change something you need to test it first, and that’s what an A/B test is all about. It’s the most powerful technique a marketer has in their arsenal to be able to move the needle in the right direction. With the correct A/B test methodology a brand could improve its design and UX over time to achieve its sales and marketing goals.
In this post, we’re going to teach you how to set up and perfect an A/B test for your eCommerce site.
Let’s jump in.
What is an A/B test?
An A/B test is a process of showing two variants of an element on a site, displaying it to two different segments of the audience, and measuring the conversion of each. On average, an A/B test should run for a minimum of 2 weeks but can go up to 2 months (depending on the amount of traffic a site gets).
What is split testing?
Split testing is a term that is often used interchangeably with A/B testing. Split testing refers to the idea that the traffic is equally split between the existing variations in a test. Split testing is typically run on landing pages or product pages though you can split test any page on your website.
What is an A/B test vs a multivariate test?
An A/B test is when you are testing two or more versions of an element on the site. A multivariate test is when you test multiple combinations of a few key elements in order to find the winning combination.
Here’s a visual explanation of the difference from VWO’s guide on A/B testing.
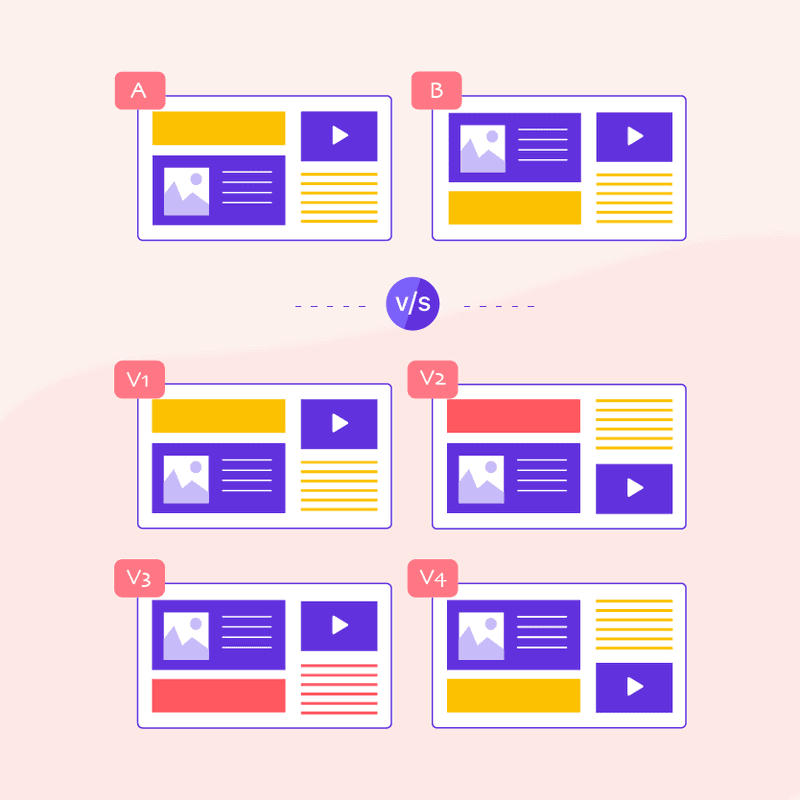
A multivariate test has more complexity and should only be used for large sites. If your site is too small and doesn’t get more than 20k monthly visitors then you won’t be able to collect enough data for a multivariate test.
You can either pick two combinations that you think are the best ones and test those or test each element in a separate test. It will still give you a similar result, but will just take more time.
When should you A/B test?
Ask any CRO marketer and they will tell you that you should constantly be testing. Every 1-2 months, you should have a different test set up. The problem is, with smaller companies & brands that kind of pace is just not realistic.
Smaller eCommerce businesses often lack the time and resources to put into running an A/B test every month. If you do have the resources, you can greatly improve your bottom line and overall performance of every single marketing channel, with the right testing strategy.
If you don’t have the resources then you need to save an A/B test for when you really need it. For example, if you’re not hitting a certain business goal it might be a good time to check the conversion rate of your site and test a few things.
There are different scenarios when you should run an A/B test, let’s explore some of them.
When launching a new feature
This is part of the agile methodology that we talked about before. The idea here is that instead of throwing money at developing a brand new site, you can develop one feature at a time while testing every single change.
So many companies do massive redesigns only to see their conversions flop. So be smart and use the agile way of creating one feature at a time, and testing as you go.
So when you are ready to launch a feature, first create your prototype(s). Then, run an A/B test with your existing version and your new version, and see which one does better.
To increase your bounce rate
Sometimes an entire category is not selling well and your sales guy wants to take it “off the shelves”. This is a great time to look at the specific pages that aren’t converting, and see if you have a problem with the bounce rate.
A bounce rate occurs when a user lands on your page, doesn’t find what they are looking for and goes back to the search results. If the bounce rate is really high then your users are leaving without purchasing anything. There could be a number of reasons - too many options to choose from, a message mismatch, or not enough clarity in the CTA’s and various elements of the page.
This is a great way to pause and test the most problematic pages. You could change the colors, the layout, make the CTA’s clearer, or change the content on the page.
To improve a low-converting channel
Sometimes a marketing team launched a channel - say Facebook ads - and they’re not successful. The conversion rate on that one channel lags behind the other already existing marketing channels.
It’s not always a problem with the channel itself, but with the landing page.
Sometimes a simple tweak can bring that message match that the users from that one channel are looking for.
One of the brands I was working with was getting a lot of clicks from Facebook ads but very little sales. They saw that their video ads were doing particularly well so they A/B tested adding more video content to their pages and they started seeing lower bounce rates, longer visit duration times, and more conversions.
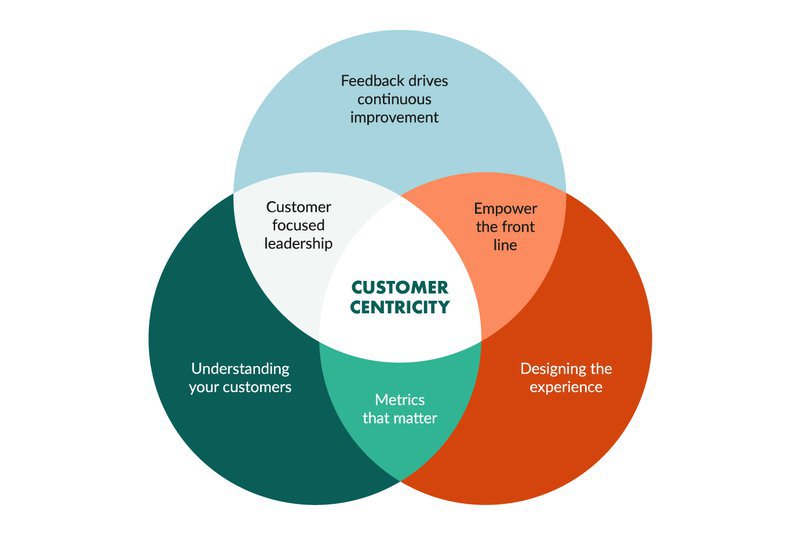
Focus on the customer
The secret behind every successful A/B test is keeping your focus on the customer.
Businesses that are in touch with their customer’s needs, demands, requests, are much more likely to experience above-average conversion rates.
At the end of the day, it’s all about the elements and the design that helps your customers convert, and not the elements and design that you or your team like best. A business that focuses on the customer will be more successful because it is listening to its customers’ needs and designing its site and user experience (as well as the customer experience) accordingly.
Create a customer-centric system
The Achilles heel of customer-centricity is getting the wrong data or asking the wrong people.
Most people think that the best way to improve is to just ask the customer. Businesses often end up asking the wrong group of people. This is known as a sampling bias - picking the wrong sample.
I worked for a startup a number of years ago where they were creating a new site. They decided to go outside and literally talk to strangers on the street and ask them what they thought of their site.
What ended up happening?
They spent way too much money developing features based on that feedback, took too long to get an MVP (minimum viable product), and had to shut down.
Such a shame, it was a really good idea, just the wrong execution.
So when it comes to gathering data from our actual or potential customers, we don’t want to make this a disorganized process, where we randomly reach out to some 10-20 customers, start asking them questions, come up with solutions and then implement them right away.
The cost of something going wrong in this kind of ‘lazy’ process far outweighs the potential benefits.
What’s wrong with this approach?
Simply put, implementing sitewide changes based on a 10-20 person sample size can lead to very poor website performance. There could be lots of biases in the data, and none of it could be accurate. You need to systematically collect user data on your site for an A/B test to work properly.
For that reason, it’s important that we have an internal process for conversion optimization efforts, a step-by-step framework for improving the conversion rate on the site.
Use a step-by-step method to improve your conversions
Here’s a super simple CRO method that I developed for my agency called Shivook. You can adopt this methodology to your own website and tweak it as you see fit for your exact needs.
In short, the methodology is as follows:
- Observe
- Research
- Come up with ideas
- Create a hypothesis
- Wireframe
- Design/Prototype
- Test Usability
- Document Specification (Process Logic)
- Conduct the A/B test
- Analyze
- Implement
Throughout the rest of the post, I am going to dive a bit deeper into the different steps of the methodology so that you can use this post as an optimization checklist for your efforts.
Observe
Observe is the first stage of the process. This is where we gather all of our user data. For most sites, it starts by looking at the Google Analytics data in order to answer one simple question.
Where can we have the greatest impact on conversion rate right now?
In order to discover this, we first must be 100% sure that conversion/goal tracking is set up 100% correctly in Google Analytics. If not, we’ll be wasting time trying to improve something we cannot track.
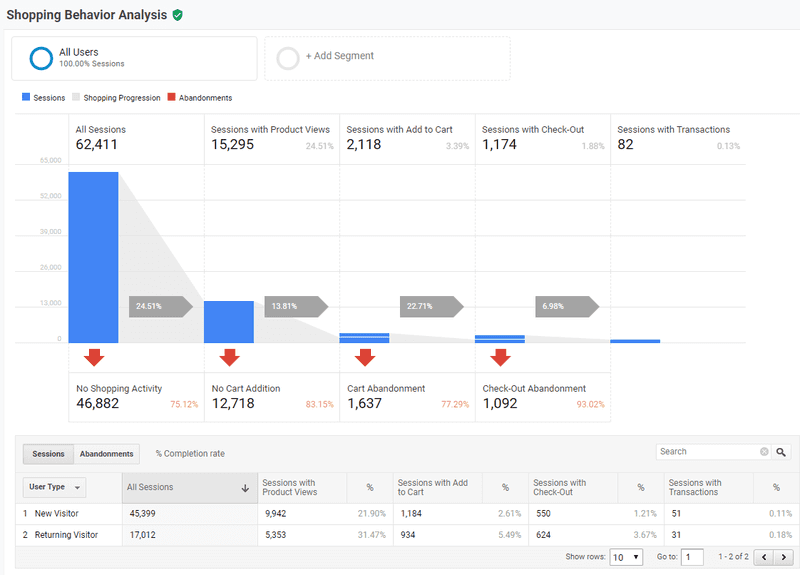
To answer the “where”, we must look at the data, which will hopefully show us specific user segments where the conversion rate is relatively low or relatively high.
Then, we can dig deeper into those segments to find the micro-segments which are underperforming and dragging conversion rates down.
Research
Research is the combination of a few elements which help us answer the question ‘Why’. That is, “Why are people behaving like that and dragging down conversion rate for that microsegment?”.
Our research most commonly includes the following 2 steps:
Step 1: Surveys
Set up User Surveys on the Key Pages Identified from the ‘Observe’ Stage.
Depending on the page & question you may want to use exit-intent popups so that you don’t add unnecessary friction to the user’s experience.
You can get user feedback through a handful of tools.
If you use a tool like HotJar, you can use their “Question Bank” to come up with question ideas.
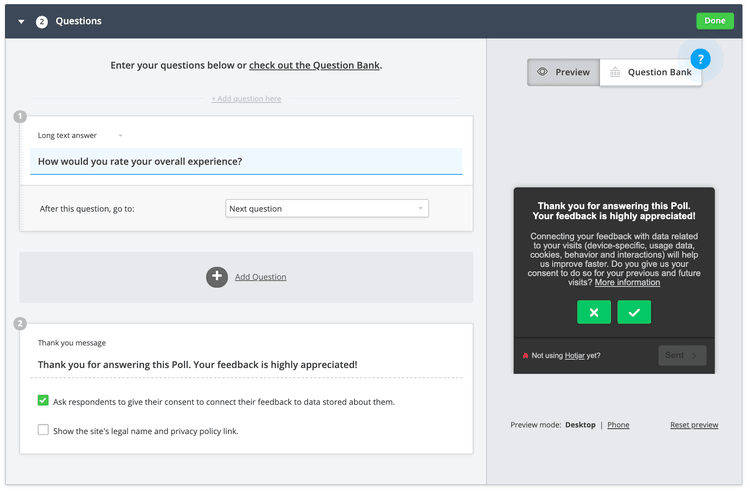
The goal is to identify and discover why people are not converting on the site, and what are some of the issues that contribute to that.
Step 2: Heatmap/Scrollmap Setup & Analysis
Set up heatmaps on those key pages identified in the ‘Observe’ stage & once enough data is collected, analyze the results.
You should be looking through heatmaps, scroll maps, and ideally reviewing some session recordings as well.
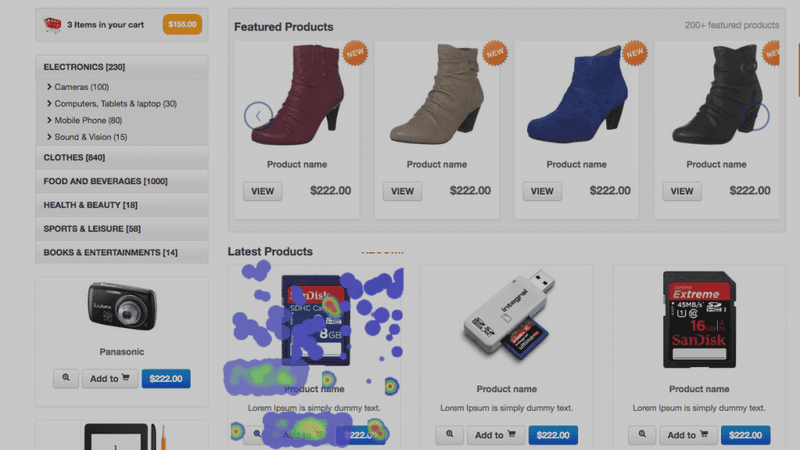
Once you’ve analyzed user feedback and combined that information with user behavior analysis (from your heatmapping tool), you can document your research & look for common patterns of conversion bottlenecks.
Pro tip: Don't forget to look at your email marketing campaigns. Those need to be tested as well. Check out our guide to Mailchimp's A/B testing features to learn more.
Come up with ideas
Now it’s time to take the research from the previous stages along with inspiration from other brand experiences and come up with an idea for what we’re going to be testing.
This is often explained as the potential ‘solution’ to the problem.
Before coming up with ideas, you may want to spend a few hours completing an internal CRO audit. This way you will know that you’ve covered every possible area of your site that you should test.
Here are a few examples of good A/B testing ideas:
- Display different content for first-time customers and returning visitors
- Display lifestyle images or images of people using your products instead of generic product images
- Test the order of your product categories in the top menu
- Simplify the checkout process by taking out unnecessary steps
- Test a one-page checkout versus a multi-page checkout
- Experiment with making the discount code on the checkout less prominent
- Display personalized product recommendations based on user data
- Test different headline wordings and different text in your product descriptions
- Display a prominent product video as the main “product image” on each individual product and see if that increases conversions
Come up with a hypothesis
A hypothesis is an educated guess about what should be done with the data we got in the first stages. Pick one or a few of your top ideas and really develop them in this step.
When we create a hypothesis, we are really doing two things.
Firstly, we’re documenting a benchmark by which we’d like to improve our conversion rate.
It’s best to get as granular as possible here in the data so that we can measure fluctuations in the segment conversion rate more effectively later on.
Need help coming up with the right idea to test? Want to take a structured course on it? Check out our list of the top eCommerce courses to learn this year.
Next, based on past A/B test learnings and/or the amount of user feedback we have identifying the problem we need to solve, we can come up with a general estimation of how much we’d like to improve the conversion rate in relation to its benchmark.
Wireframe
Once we’ve come up with some initial ideas, we’re going to want to build a more visual representation of those ideas by creating a wireframe.
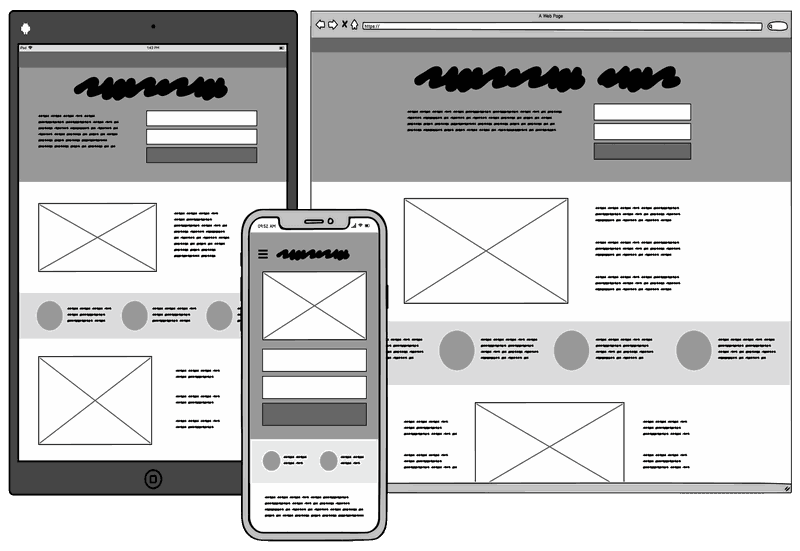
The wireframe is a rough skeleton of how we see the idea being implemented on the website.
It is used by the designer to get a general understanding of element placements.
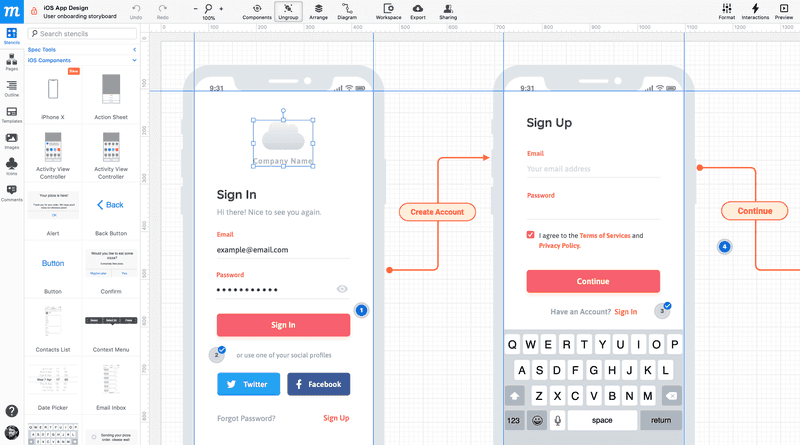
Create a design/prototype
Now take the wireframes that you’ve made and bring them to your design team. It’s time to build on them and turn them into real designs for your site or mobile.
Test the Usability
Double and triple-check every prototype you made because you don’t want to be running A/B tests for solutions that have obvious usability issues.
A usability issue is best described as something which does not work as one would expect. If enough people encounter the same expectation and the solution does not meet that expectation, it is unlikely to serve as the solution to the initial problem.

Usability testing can most easily be done via 3rd party websites like UserBob, Usability Hub, and a handful of others.
After doing usability testing, we document feedback from the testers so that we can develop A/B testing variations that will perform AT LEAST as a minimum viable product (MVP).
Document Specification (Process Logic)
Documenting a specification (process logic) is where you explain how the design variations for the A/B test should function.
Why is this important?
You may have sections of the design that are dynamic based on some specific criteria. It’s important to use the specification to help explain to the developers what those criteria are and how they will operate and affect the live design.
This is where you will be writing out exactly what changes you need to make and how everything works.
Conduct the A/B Test
Although this post is primarily focused on A/B testing methodology, this is actually the only part of the methodology where we’re performing actual testing.
That’s because, as explained above, improving conversion rates is more about a methodology than just testing ideas.
For A/B testing, it is highly recommended to use an A/B testing tool to set up your different variations, once they’ve been developed by your developers.

Here are some recommended A/B testing tools:
- Google Optimize (free)
- VWO (paid)
- Unbounce (paid)
Here’s a full list of A/B testing tools.
Analyze the results
When the A/B test is finished, one of the most important (and often overlooked) stages of the testing methodology is analysis.
At this stage, it’s vital to review the data and try to gather as much information as possible regarding user behavior across the different testing variants.
Variants that greatly overperformed are equally interesting to analyze as those that greatly underperformed.
Why?
Because this reveals a lot of insight about the customers and how they are using our website. It helps you determine which elements on your site influencer purchasing behavior the most.
The analysis is usually done through Google Analytics & Heatmap/Scrollmap/Session Recording tools.
Make sure to document your analysis to help guide you in future user testing.
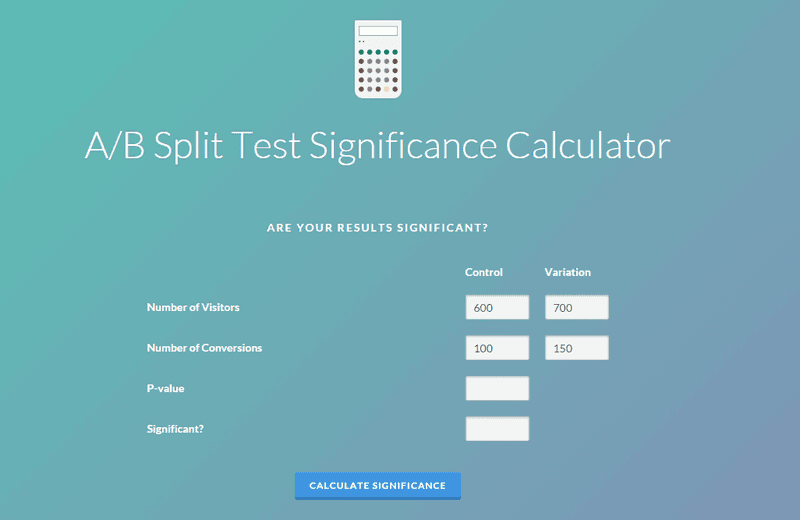
Also, make sure that your test results are statistically significant. You can use a simple statistical significance calculator to find that out. This will show you which results are influential and which ones you should disregard.
Implement
When a test shows statistical significance and in a positive direction, it’s time to implement the test changes across the entire website.
This may require some optimization of the copy and/or the design, and may also require some additional development work that was not done on the test version.
This is something to consider when moving from the testing phase to the implementation phase.
Remember, the main purpose of any A/B test is to improve site conversions and make more money. If your A/B test is successful, it should yield a positive result. Anything less than that requires more testing.
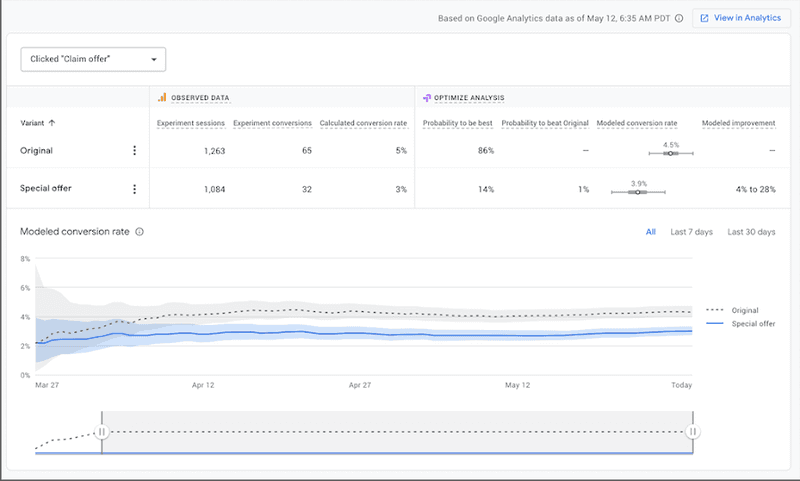
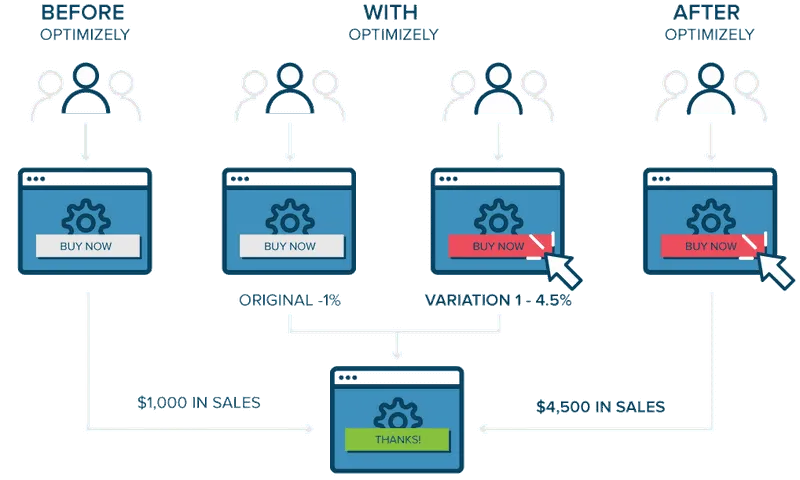
Here’s an example of a successful campaign, and something that you should be striving for:
Hire an Expert A/B Tester
We covered a really good and comprehensive method to set up and run an A/B test for your site. If you follow this testing process you are guaranteed a long-term significant impact on the conversion rate.
All else is a game of risk and taking chances - something less recommended in the world of business unless you have the resources to do so.
You can use the methodology outlined above or tweak it and create your own. And remember, always make marketing decisions based on actual user data. And if you need help, hire one of our experts today!


![[Interview] Andy Crestodina on How to Write the Best Content for eCommerce](https://entail.mayple.com/en-assets/mayple/fit-in/280x280/617ffbda87b85d76b2646986_maypleandycrestodinainterviewcontentmarketingforecommerce_15e1b97b4bf3af165365d906b9c5bea3_2000-1699776043224.png)