How Create a Campaign Performance Report to Wow Stakeholders
Campaign performance reports are essential to understanding the success of marketing campaigns. Get these tips for presenting that data in the best way.
Updated November 6, 2024

Decoding campaign success: the art of performance reports
"The campaign was a raving success" might sound like the most exciting sentence in the world. Whether you're a CMO, an email consultant, or a copywriter, you want to hear and utter those words as often as possible.
Unfortunately, stating success without quantitative data is not enough – certainly not in a world with 64 zettabytes of information floating in cyberspace, and where every C-level leader, manager, and investor needs to have numbers on the table.
Creating comprehensive campaign performance reports is essential in digital marketing, no matter what channel you're focusing on. Whether email marketing, social media, or organic search, you need to make sure you collect, manage, analyze, and report on your campaigns' performance regularly.
How to do it well?
Keep reading and find out more.
What is a campaign performance report?
A campaign performance report is a rundown of all the key activities you do to promote a product or service, during a given time period, as well as the results these activities yielded. Reports normally include channel-specific metrics, cost-effectiveness, ROI, and other performance indicators.
These metrics are gathered from diverse sources such as Google Analytics, social media analytics, email marketing platforms, and more. The report provides insights into the campaign's success and helps understand the effectiveness of different marketing channels and strategies employed.
How to build a campaign report
Crafting an effective campaign performance report involves strategic planning and meticulous execution. Here's a roadmap to guide you through this process:
Determine your KPIs
Defining your KPIs is the foundation of a robust report. Key performance indicators serve as benchmarks for evaluating the success of a campaign. You should carefully consider your KPIs to ensure they align with your marketing campaign and business goals.
These KPIs can range from measuring brand awareness (through metrics like impressions and reach) to assessing bounce rates and accounting for conversion rates and customer retention.
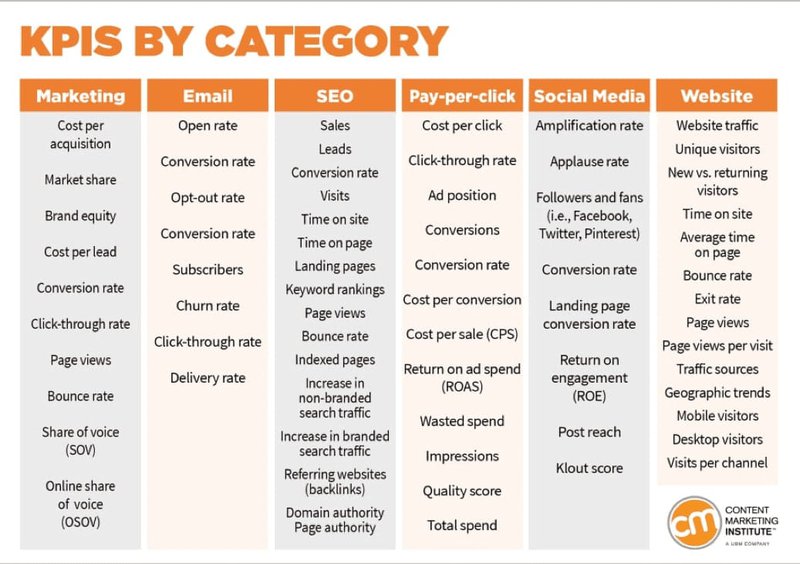
Don't track too many performance metrics
While KPIs are crucial, avoid falling into the trap of tracking an excessive number of campaign performance metrics. Focus on the ones most relevant to your campaign goals to maintain clarity and relevance. Too many metrics can clutter the report and make it difficult to discern meaningful insights. Choose a handful of metrics that help you see what's really going on in your campaigns.
To do this and ensure your chosen KPIs show your work's impact on the bottom line, focus on building an attribution model and monitoring the metrics connected to it.
Determine report stakeholders
Identifying the key stakeholders who will consume and utilize the report is essential. They are your audience, so your report should address their needs and expectations.
For example, executives may require a high-level overview with concise insights, while marketing leaders might need a more detailed breakdown of metrics and trends. Understanding your audience ensures that the report serves its purpose effectively.
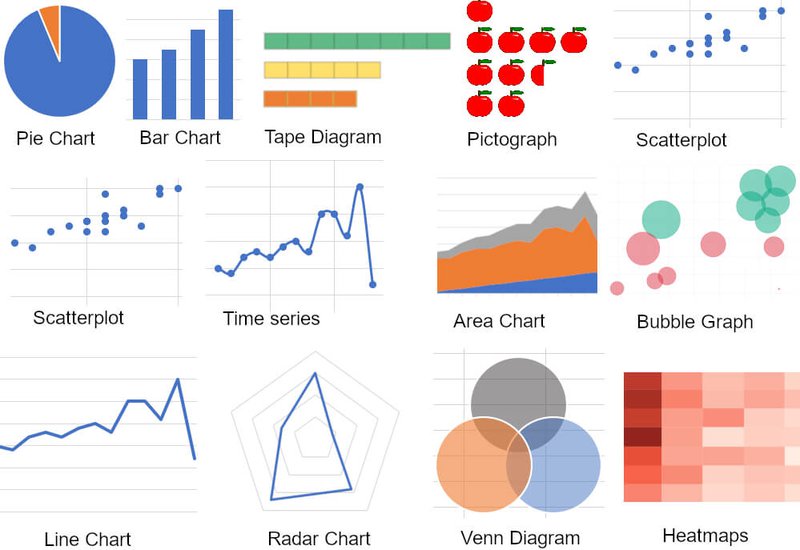
Include data visualization
Use graphs, charts, and visual aids to present complex data in an easily digestible format. Visualizations enhance comprehension and make the report more engaging. For instance:
- A line chart can effectively show the trend in website visits over the campaign period, providing a quick and clear understanding of the campaign's impact on website traffic.
- A pie chart can depict sales distribution among different marketing channels, giving a visual representation of channel effectiveness.
- A bar chart can compare conversion rates across various demographics, highlighting any patterns or trends.
Provide context and analysis
More than just numbers and charts, a report should also provide context and insights. For example, explaining why a particular metric performed well or poorly can help stakeholders understand the reasoning behind the numbers.
An analysis of how the campaign performed compared to other campaigns or other time periods is also valuable. This will help stakeholders understand the effectiveness and progress of the campaign.
You should also be sure to suggest further steps and recommendations based on the report's findings. This will demonstrate your own critical thinking and proactive decision-making.
Automate report creation
Thankfully, we no longer live in the manual report creation age. A few short decades ago, someone (probably you) would have had to spend days copy-pasting or (shudder) manually processing data to create reports.
Today, automation tools make your job much less tedious and provide more accurate, real-time data. With these tools, you can easily generate performance reports in minutes, freeing up your time for more critical tasks.
Automation not only saves time but also ensures consistency and accuracy in reporting. Platforms like Google Data Studio and dedicated marketing reporting tools allow you to automate data collection and report generation, enabling real-time tracking and timely insights.
Types of tools to use for campaign performance reports
Choosing the right tools for campaign performance reporting is essential. Here are two categories of tools to consider:
Individual or channel-specific tools
Most marketing tools come with at least basic analytics and reporting features embedded in the system. Additionally, there are also stand-alone analytics tools used to track website traffic and other performance metrics specific to a particular channel, such as social media or email marketing. These tools provide in-depth insights into the performance of a specific channel and can help evaluate the effectiveness of your campaigns on that platform.
Some examples of this category include
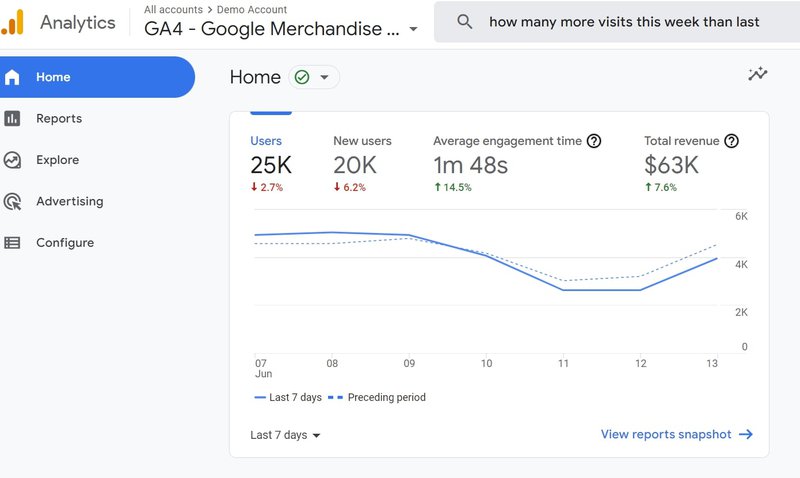
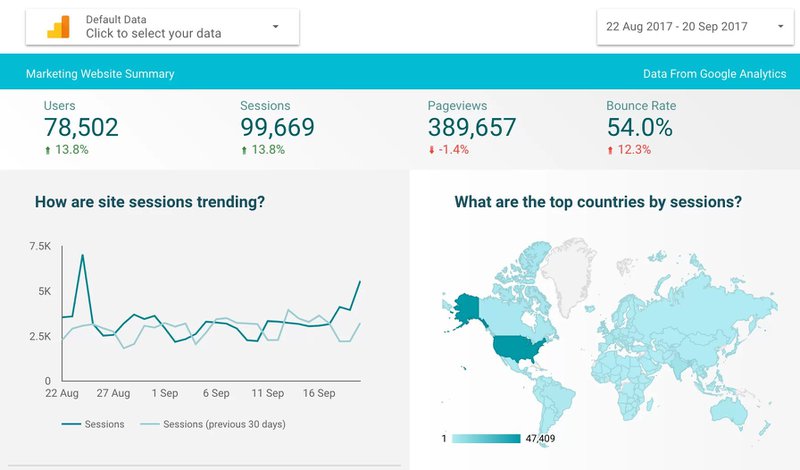
Google Analytics
Google Analytics is an all-encompassing tool for tracking website traffic and user behavior. It provides insights into how visitors interact with your site, what pages they visit, which links they click on, how long they stay, and much more. By understanding user behavior, you can optimize your campaigns for better results.
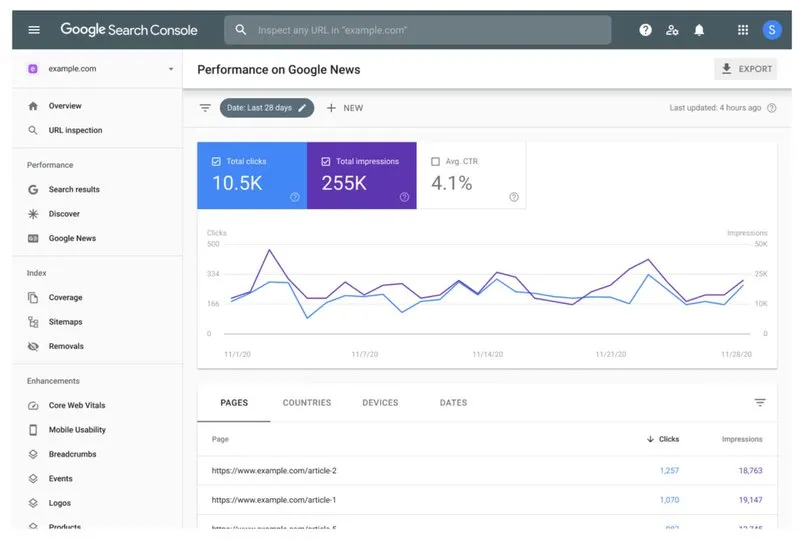
Google Search Console
GSC provides valuable data about how your site performs in Google search. It offers insights into your website's click-through rate (CTR), impressions in SERPs (search engine results pages), search queries that led to clicks, and the average position of your site in search results. This data is crucial for evaluating the success of your SEO strategies.
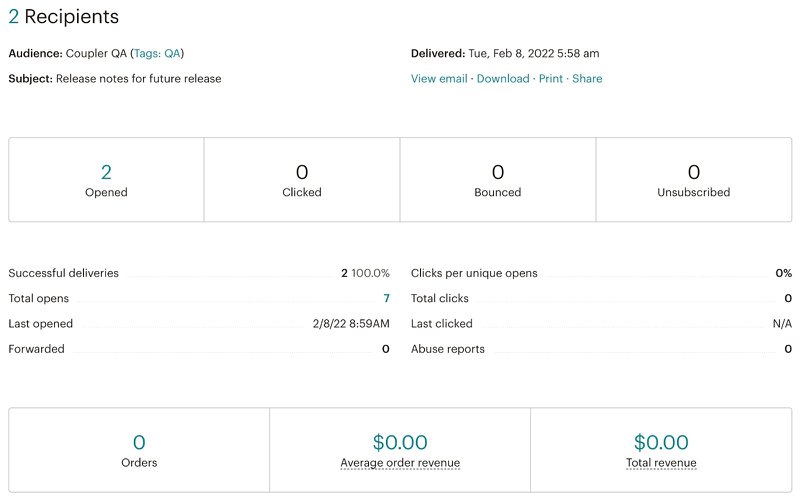
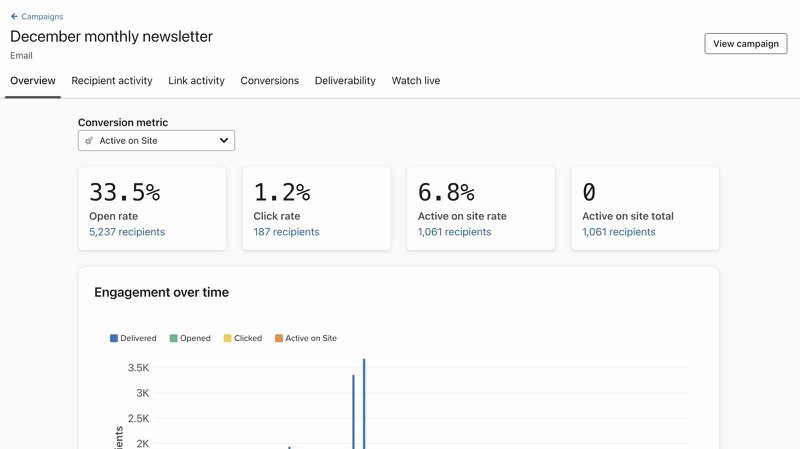
Email marketing tools
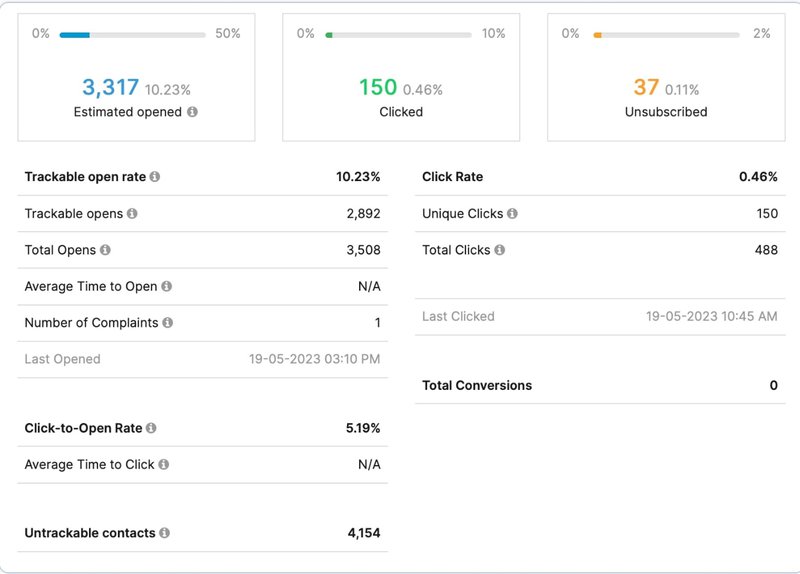
Platforms like Mailchimp or Klaviyo offer comprehensive email campaign analytics. These email tools provide metrics such as open rates, click-through rates, unsubscribes, etc. Because email is one of the few owned channels (along with websites), analyzing email campaign performance is key to understanding audience engagement and interest.
Each email software application has its own way of providing you with campaign performance data, but here are some popular examples:
Mailchimp
Klaviyo
Omnisend
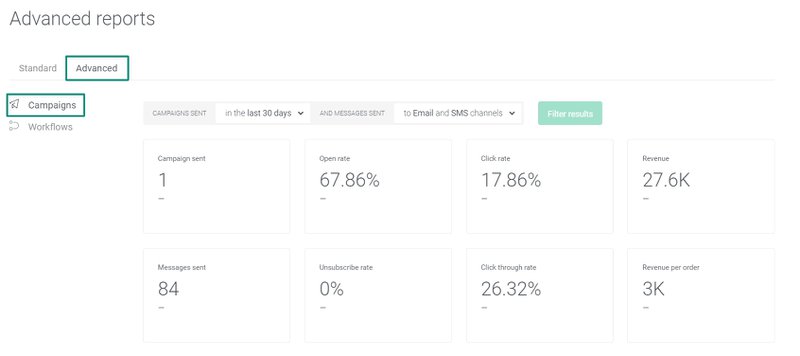
Brevo
Social media tools
Each social media platform provides its own set of analytics to track campaign performance. Metrics like reach, engagement, likes, shares, and comments help understand how your campaign resonates with your audience on various social platforms.
For individual or personal LinkedIn accounts, you'll also find tools like AuthoredUp, Taplio, and Shield, which provide powerful insights into specific content performance.
Paid marketing tools
Tools like Google Ads or Facebook Ads Manager give detailed insights into paid campaigns. You can track impressions, clicks, conversions, and the overall return on investment (ROI) on your paid advertising efforts, as well as analyze audience demographics and other relevant data.
Campaign report builders
Campaign report builders are usually cross-channel, or at least help you build reports across different platforms within the same channel category. These tools are beneficial because they save you from the hassle of manually exporting data from individual platforms and compiling them into a single report.
Plus, most campaign report builders offer customizable templates, making presenting data in visually appealing formats easy.
Some examples of popular campaign report builders include:
Metrics Watch
Metrics Watch is a comprehensive reporting tool that integrates data from various platforms, simplifying the reporting process. It aggregates data from multiple sources into one dashboard, providing a centralized view of campaign performance. This is especially useful for campaigns that utilize multiple channels.
Google Data Studio
Google Data Studio allows you to create interactive and shareable dashboards to visualize your data. You can pull data from various sources and present it in a way that suits your reporting needs. The platform offers a range of visualization options, making it easy to customize your reports.
DashThis
DashThis is an intuitive reporting tool with pre-built templates and customization options. It allows you to create comprehensive dashboards that showcase campaign performance across different channels. The tool integrates with various platforms, making it easy to gather and present data in one place.
Blue Shift
Blue Shift offers analytics and reporting capabilities to track customer engagement and campaign performance across channels. It provides insights into customer behavior, preferences, and interactions with campaigns. This data is crucial for optimizing future campaigns and ensuring they resonate with the target audience.
Additionally, some tools help you create and manage various campaign types on different channels, and they'll usually have their own analytics and reporting tools. For instance. AdEspresso allows you to create and manage paid campaigns on Facebook, Instagram, and Google Ads, and it comes with its own reporting features.
Sections every campaign report should include
When compiling your campaign performance report, ensure it comprises the following vital sections to provide a holistic view of the campaign's impact:
Summary
The summary section encapsulates the campaign's objectives, strategies, and a brief on performance against KPIs. It sets the stage for the rest of the report, offering readers a quick understanding of the campaign's essence and goals.
Interaction metrics
Interaction metrics showcase how users interacted with your content, such as clicks, views, and impressions. These metrics provide insights into your campaign's engagement and appeal to the target audience. Understanding user interaction helps optimize future campaigns for better engagement and conversion rates.
Some of the commonly tracked interaction metrics include:
- Click-through rate (CTR)
- Impressions
- Views
Engagement metrics
Engagement metrics delve into user engagement levels, encompassing metrics such as:
- Likes
- Comments
- Shares
These metrics provide a deeper understanding of how users connect with your content and brand. Effective engagement indicates that your campaign struck a chord with the audience and resonated with them.
Channel-specific metrics
Channel-specific metrics are tailored to each marketing channel utilized in the campaign, offering a detailed view of performance on that particular platform. For instance, the following metrics are vital on social media:
- Reach
- Engagement
- Follower growth
For SEO content, however, the following metrics are important:
- Clicks
- Impressions
- Average position in search results
Understanding channel-specific metrics helps evaluate the success of your campaign on each platform and identify areas for improvement.
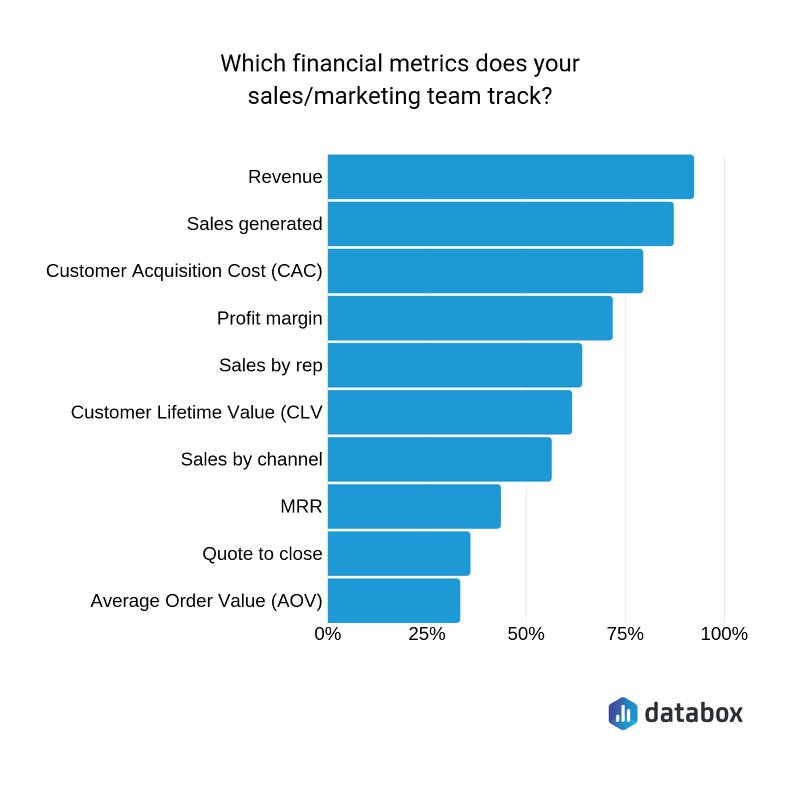
Conversion or financial metrics
Conversion metrics measure how well your campaign converted leads into customers. These include:
- Conversions (purchase, sign-up, etc.)
- Conversion rate
- Cost per conversion
- Revenue generated
- Cost per trial
- Return on investment
Conversion metrics help determine the campaign's return on investment and overall impact on business goals.
Use case metrics
Each type of report has its different use cases and metrics, so the data you showcase should adapt to that. For instance, if you are preparing a report for an eCommerce business looking to segment product lines according to demographic data, you might want to focus on metrics that show how different age groups and genders perform in your eCommerce email campaigns. On the other hand, if your report is for a company seeking to increase brand awareness, you may want to focus on engagement metrics such as likes, shares, and comments.
Likewise, if you are preparing a report on your latest Father's Day email campaign, it will likely look different than regular email campaigns, like your welcome emails or browser abandonment ones, for example. A one-off or annual campaign is measured against different benchmarks (past performance for similar campaigns, sales figures, etc.). However, an ongoing campaign is often tested against an established target, such as open rates or click-throughs.
Actionable Insights
The final section of your campaign report should provide actionable insights based on the data. Explain briefly, how you translate all the information and the next steps to take to address potential issues or scale on the successful aspects of the campaign. This section should provide a strategic outlook on improving future campaigns based on the current data and performance.
Campaigns performance reports: like stories, but with numbers
Ultimately, you should look at your campaign performance reports as more than just fancy tables filled with data. Yes, the data is crucial in understanding how your campaign performed, but it also tells a story. Use your reports to understand what worked and what didn't, and use that information to create better campaigns in the future.
Every story has a hero, a villain, and a journey the hero takes to overcome the challenges presented by the villain. Similarly, your campaign report should showcase the hero (the successful aspects of the campaign), the villain (the challenges faced), and the journey (the marketing strategy and tactics you implemented).
This narrative approach helps stakeholders understand not just what happened, but why it happened and how it can be improved – providing a bird's eye view of how campaigns are really performing, beyond nit-picked metrics.
More than anything, building healthy performance reporting practices puts you, the marketing manager, email marketer, or social media specialist in the driving seat, showing that you know the path and the steps needed to get there.


![[Guide] How to Write an Email Preview Text to Inspire Clicks + Examples](https://entail.mayple.com/en-assets/mayple/fit-in/280x280/64aeffb50397d41ab5aa380c_3031200x675mayplefp169189_0273a99d430548e6c54143747665786d_2000-1699518255187.jpg)