Facebook Ads Reporting - How to Track Your Performance in 2026
Need a new FB Ads report to help you optimize your campaigns? Here are the best Facebook Ads reporting tools + the most important KPIs + templates + examples
Published November 5, 2024

“When performance is measured, performance improves. When performance is measured and reported back, the rate of improvement accelerates.” – Pearson’s Law
It's no secret: Facebook ads is a whole different ball game in 2026. In fact, Facebook ads and "change" are synonymous today. So synonymous that if we were to count the changes they've rolled out since launching in 2007 would put us on the red radar of Google's content guidelines.
And when change is prevalent in your ads life, there's one thing that needs to be done consistently: properly tracking your campaigns (an activity known to help prevent loss of profits and loss of minds - the former's more proven, but the latter is hearsay, of course).
Tracking your ads campaign performance is crucial to producing a winning campaign. Knowing what data points to keep an eye on will help turn a losing or break-even campaign into a winner. By learning how to set up and use Facebook's Ads Manager effectively, we are able to make data-driven decisions and tilt the odds in our favor.
Here’s how to set up your Ads Manager and which reporting templates to use to help you see important data at a glance and make campaign decisions effectively.
Facebook ads reporting in the Ads Manager
Let's dive into tracking your Facebook ads performance in 2026.
1. Decide on your campaign KPI's
It all begins with your KPIs (Key Performance Indicators). Facebook is such a robust advertising platform, there is a ton of data to look at and you need to pick the right metrics to focus on.
That's why Facebook provides a number of preset options for the most popular types of campaigns so that only the relevant metrics are displayed and the rest are filtered out.
For example, a video views campaign would require KPIs such as:
- 3-second video plays and their cost
- ThruPlays and the cost per ThruPlay
- Video average playtime
- Video plays at 25%, 50%, 75%, and 100%
- Video view type
- Impression device
- Conversion device
All of these are relevant metrics that can help you pinpoint exactly where viewers are dropping off in your video campaign.
For example, if you notice that your video views drop off at 50% then you should consider editing that section and run another test to see if the video plays metrics improve.
A sales campaign for an eCommerce store would have an entirely different set of KPIs. These could include:
- CPM (cost per one thousand impressions)
- CTR (link click-through rate)
- Landing page views
- Link clicks
- Cost per click
- Conversion rate
- # of adds to cart
- # of checkouts initiated
- Purchases
- Cost per acquisition
- ROAS
Additionally, all campaign types have some basic key metrics that should be included with every campaign report. These include metrics such as Budget, Amount Spent, Reach, Impressions, and CPM.
In case you are not satisfied with Facebook's preset options, you can also create your own custom column list by clicking on Customize Columns and then selecting which metrics you would like to add to the report.
So, the first step is to decide on your KPIs. Then, you move on to:
2. Look at your campaign breakdowns
Now that you have some data coming in, it's important to look at the data more granularly. These advanced breakdowns can give you insights into which segments of your audience are most engaged with your campaign. Which engagement metrics you look at depends on your campaign objective.
To see your breakdown options, click the Breakdown button next to the Columns button.
Facebook allows us to break down a campaign at the campaign level, at the ad set level, and at the ad level. Within the breakdown section, there are 4 possible subsets which are:
- Action - the actions that people took during and after interacting with your ad.
- Delivery - the demographics of the audience that the ad was delivered to, as well as the platform and device it was viewed on.
- Time - the different time frames that each breakdown can be sorted in.
- Dynamic Creative Element - Breakdown by the creative element in a DCA (Dynamic Creative Ad) such as text, image, or headline.
For example, you could break down your campaign by age and gender (under the delivery subset) to see which age cohort and which gender is producing the best results.
Then, you could create a new campaign specifically for that age range and gender, and change your ad image and text to match that demographic.
This leads us to the final step...
3. Share and export your campaign data
Facebook allows you to both share and export your campaign data. Under the Reports section, when you click on Share link, Facebook will generate a unique link that you can send to anyone and they will be able to view your campaign report.
You can also export the campaign data by clicking the Export table data option under the Reports section. This will allow you to export your data into a CSV or Excel file, or view it in Google Sheets, which can be very useful when you would like to use advanced spreadsheets or data visualization tools.
And that's it! You now know how to create the perfect Facebook Ads report for your campaigns, and how to utilize it most effectively.
Top Facebook Ads reporting tools
It doesn't take a village but it does take having the right tools! Reporting (subsequently and interpreting data to make marketing decisions) is one of the most impactful activities you make as an ads specialist.
And with the right tools and information in place, your chances for successful campaigns will be greater.
Here are some of the top tools to use to create Facebook Ads Reports.
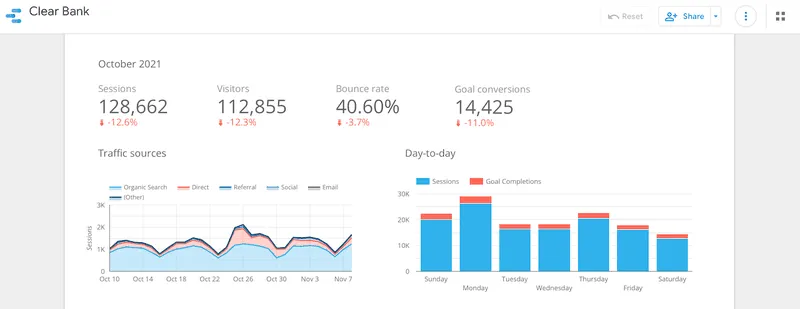
Looker Studio (formerly Google Data Studio)
Google recently acquired the analytics and reporting tool Looker and has replaced Google Data Studio with the new Looker Studio. It’s still completely free and can be a great resource for beginner to intermediate performance marketers.
Use Looker Studio to create ads reporting dashboards for your Facebook Ads campaigns and easily see your data at a glance. It could also pull in traffic data from your Google Analytics account as well to help create more advanced reports.
Features:
- Visualize data using line charts, bar graphs, geo maps, area and bubble graphs, and more
- Interactive reports with viewer filters and date controls
- Brand your reports with text and images
- Style and color themes
Pros:
- Very robust tool
- Created by Google
- Lots of integrations
- Easy to share and collaborate
Cons:
- No API
- Limited number of charts
- No real-time updates
Tool Level: Beginner
Pricing: Free
AdStage
AdStage features an all-in-one solution for managing cross-network pay-per-click (PPC) marketing campaigns, across platforms such as Facebook, Twitter, Google Ads, Bing, and more.
It is a highly customizable platform that will allow the user to dig as deep into the data as they want, and display at a glance any ads metrics that are deemed important.
Features:
- A/B Testing
- Conversion Tracking
- Budget Management
- ROI Tracking
- Bid Management
- Customizable Reports
- Schedule reports to be sent
Pros:
- Great customer support
- Lots of integrations available
- Detailed analysis of campaigns
- Drag and drop report builder
- Streamlined dashboard
Cons:
- Lack of good onboarding resources
- No Snapchat advertising support
- Platform slow at times
- Sometimes have to reconnect platforms
Tool Level: Intermediate
Pricing: Starting at $149/month
Swydo
Swydo is a web-based platform that offers tracking, reporting, and monitoring capabilities. It integrates with the most popular platforms such as Google Ads, Facebook Ads, Bing Ads, LinkedIn Ads, Google Analytics, Google Webmaster Tools, and more.
Additionally, Swydo offers a custom integration feature that allows users to build their own integration with the tools they use.

Features:
- API access
- Customizable branding
- Data import/export
- Email templates
- Ads report templates
- Cross-channel reports
- Public dashboards
- Custom reports
- Real-time monitoring
- Multi-channel attribution
Pros:
- Highly customizable
- Fast platform
- Easy to use
- Great customer support
- Multi-database integration
Cons:
- Limited design options
- Big learning curve
Tool Level: Intermediate/Advanced
Pricing: Starting at $39/month
AgencyAnalytics
Built around automation and white labeling, AgencyAnalytics features a robust platform that is highly customizable and easy to use. It was built specifically for Facebook Ads agencies to help them provide their clients with automated, white label reports.
Features:
- Automated reporting
- White label reports
- Custom dashboards
- SEO tools
- Client & staff management
- 70+ integrations
Pros:
- Great customer support
- API access
- Simple and easy to use
- Feature-rich
- Good value for money
Cons:
- Dashboards are widget based
- Can be overwhelming
- Customization of imported data is limited
- Limited keywords
Tool Level: Intermediate
Pricing: Starting at $12/month
Madgicx
Madgicx is a cloud-based Facebook advertising solution designed to help Facebook marketers monitor and improve their campaign performance, as well as add automation to the media buying process.
Features:
- Conversion tracking
- AI/Machine learning
- Behavioral targeting
- Customer journey mapping
- Multivariate testing
- Full-funnel reports
Pros:
- Easy to set up
- The creative studio provides insights
- Great onboarding process
- Many integrations
Cons:
- Built for large businesses
- Big learning curve
Tool Level: Intermediate/Advanced
Pricing: Starting at $199/month
Important ads metrics to track
It's important to understand your own campaign goals and pay close attention to the data that matters most to your specific project. Having said that, some metrics are universal across campaigns and should always be monitored as indicators of overall campaign performance.
The most common metrics are:
CPC
CPC stands for cost-per-click, and it is the universal standard when it comes to tracking media buys and campaigns. It’s a benchmark metric that can always be used to evaluate whether the campaign performance is good or bad.
CPC can be used relatively to see whether certain marketing tests have affected the campaign negatively or positively.
CTR
The CTR (click-through rate) is the number of clicks that your ad receives divided by the number of times your ad is shown. It’s an important metric for two main reasons.
1) It is used by most self-serve advertising platforms as a gauge as to how interested your target audience is in your ad. The higher the CTR, the better the message/market match is, and the more the advertising platform will reward you with better and cheaper results.
2) It can have a direct impact on the ROI of your campaign, as landing page CTR is the main leverage point that an advertiser has. For example, if a landing page CTR is 2%, simply lifting that up another 1% percent equals 50% more sales.
The CTR of the landing page is the ultimate indicator of how well your audience is responding to your offer, and the likelihood of them clicking through and completing your desired action.
CPM
CPM (cost-per-mille) is a metric used to calculate the cost of an ad for every one thousand impressions. It’s one of the most common methods for pricing ads and it’s used in brand awareness campaigns.
ROAS
ROAS is one of the most important metrics to track (especially for eCommerce stores). It stands for return on ad spend and it’s the amount of revenue earned for every dollar spent. For example, a ROAS of 3 means for every dollar spent, three dollars is earned back in revenue.
Generally speaking, as your ad reaches a larger audience, the ROAS starts dropping as the message is not relevant anymore, so it’s a good indicator that you need to change something.
An effective ads campaign involves a careful balancing act of trying to increase revenue but also keeping an eye on your ROAS as the two are inversely correlated, and the right strategy can influence future campaigns.
Facebook Ads reporting templates
While reporting can be customized for every campaign, a great way to simplify your reporting is to use pre-built ads report templates.
Here are a few of the best templates you can use.
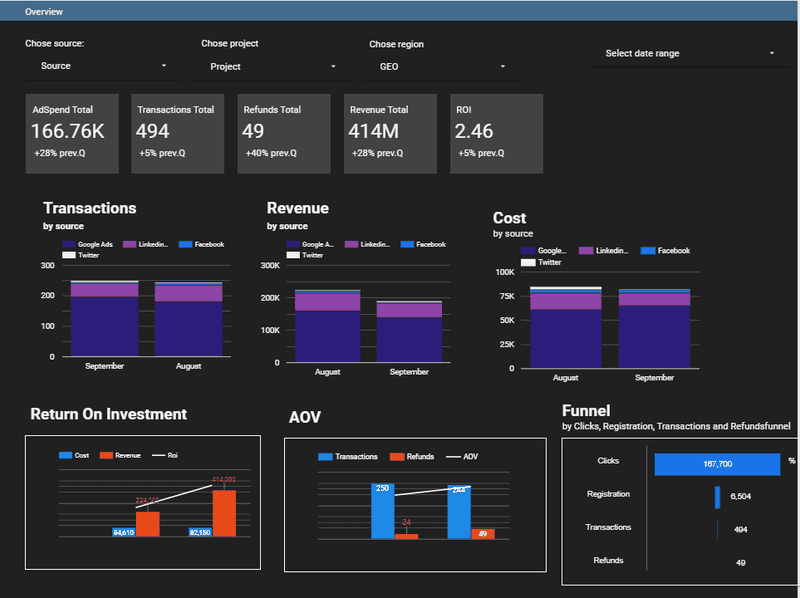
Improvado performance marketing dashboard
This is the performance dashboard you'll want to use for a high-level view of your Facebook ads. Improvado allows you to track revenue generated by each campaign, return on marketing investment, target actions by audience (clicks, purchases, registrations, etc), and total ad spend.
Pros:
- High level of customization: You can customize your reporting using any data from your Facebook Ads Reporting tool or any other platform
- Comprehensive visuals and charts
- Zero-engineering where you can turn on and off any section
- Tailored to Facebook Ads needs with visibility into all crucial conversion metrics and KPIs across your Facebook campaigns
Cons:
- It might be too complex for small businesses and often not a great solution for freelancers.
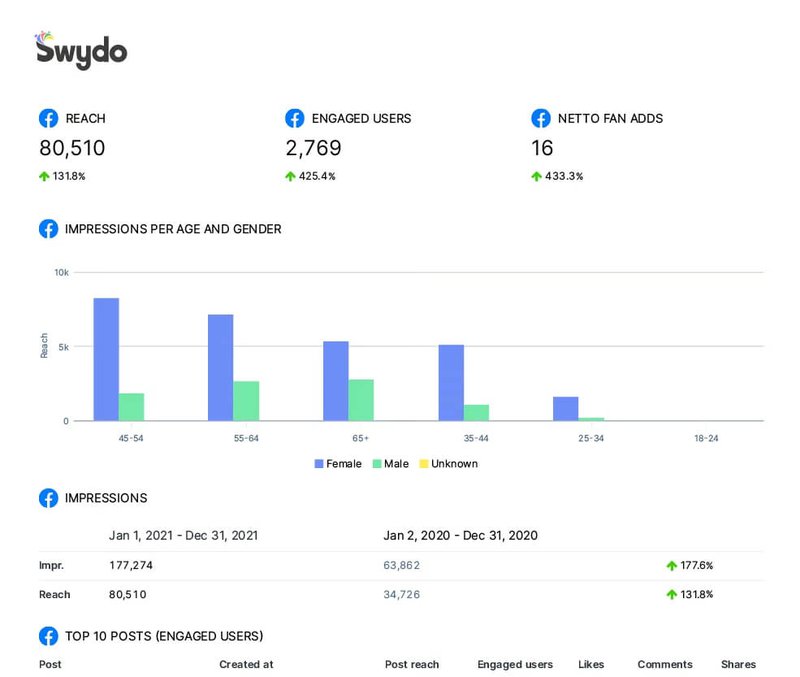
Swydo Pre-Built Facebook Ads Reports Templates
Swydo offers a set of pre-built templates you can use for your ads reporting with a user-friendly interface to connect your data sources.
Pros:
- Great for tracking KPIs and business goals with comprehensive reporting on reach, actions, shares, leads, and other performance metrics
- KPI and widget library makes it easy to generate comprehensive reports based on your client's needs
Cons:
- Slim on connectors for very big marketing teams
Supermetrics Facebook Ads Template
This is technically not a reports template (more like a tool), Supermetrics can be used with Google Data Studio to manage your Facebook ads data and it's great if you manage most of your advertising spend via Google Data Studio.
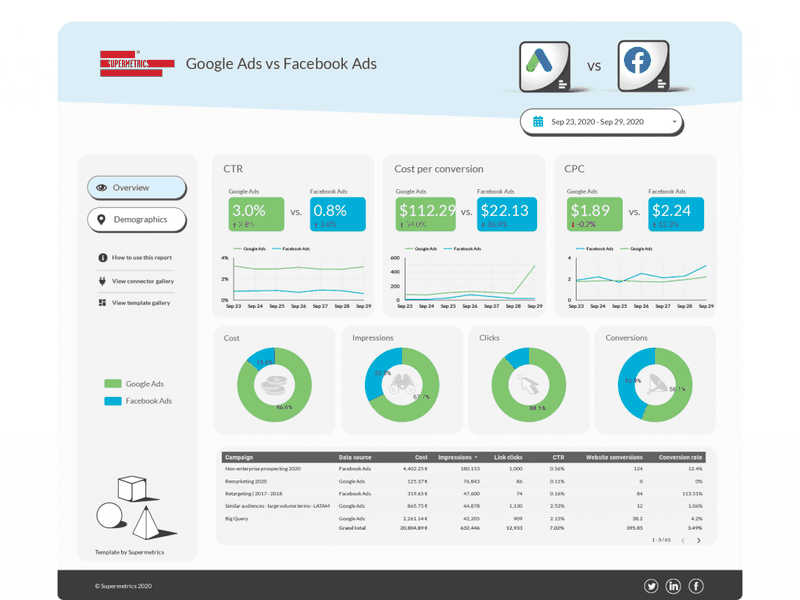
Pros:
- Generate information like basic graphs and total impressions, amount spent, and CPM
- Displays clicks, CPC, CTRs, actions, and action rate
- Lots of integrations - Google Analytics, Google Data Studio, Google Sheets, LinkedIn Ads, you name it.
Cons:
- $39 after your 2-week free trial
Takeaways
Reporting will always remain a critical part in delivering successful paid media campaigns, regardless of the size of your business or the type of campaigns you use.
It can get quite complex, but it needs to make your decisions simpler, not overwhelming. You need to select the best reporting approach, tool, and solution that matches your business needs.
And of course - if reporting and overall ads management are not your area of expertise, you can always hire a vetted Facebook Ads Expert with experience in your niche to manage your campaigns from A-Z.